Datei:Glacier Mass Balance German.png
Glacier_Mass_Balance_German.png (658 × 500 Pixel, Dateigröße: 20 KB, MIME-Typ: image/png)

|
Dieses Bild des Typs Graph sollte als Vektorgrafik im SVG-Format neu erstellt werden. Vektorformate haben zahlreiche Vorteile; weitere Information unter Commons:Media for cleanup. Wenn dir eine SVG-Version dieses Bildes vorliegt, so lade diese bitte hoch. Nach dem Hochladen der Datei ist diese Vorlage auf der aktuellen Bildbeschreibungsseite durch die Vorlage {{Vector version available}}, oder kürzer {{Vva}}, zu ersetzen. Es ist empfohlen die neue SVG-Datei „Glacier Mass Balance German.svg“ zu nennen – dann benötigt die Vorlage vector version available (bzw. vva) keinen Parameter.
|
Beschreibung
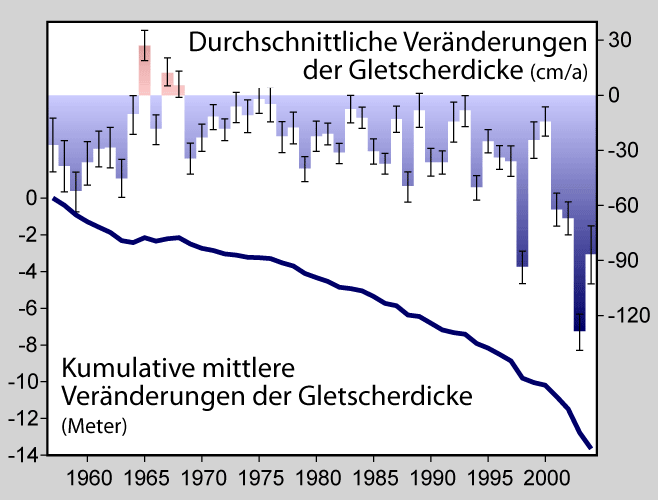
This figure shows the average rate of thickness change in mountain glaciers around the world. This information, known as the glaciological mass balance, is found by measuring the annual snow accumulation and subtracting surface ablation driven by melting, sublimation, or wind erosion. These measurements do not account for thinning associated with iceberg calving, flow related thinning, or subglacial erosion. All values are corrected for variations in snow and firn density and expressed in meters of water equivalent (Dyurgerov 2002).
Measurements are shown as both the annual average thickness change and the accumulated change during the fifty years of measurements presented. Years with a net increase in glacier thickness are plotted upwards and in red; years with a net decrease in glacier thickness (i.e. positive thinning) are plotted downward and in blue. Only three years in the last 50 have experienced thickening in the average.
Systematic measurements of glacier thinning began in the 1940s, but fewer than 15 sites had been measured each year until the late 1950s. Since then more than 100 sites have contributed to the average in some years (Dyurgerov 2002, Dyurgerov and Meier 2005). Error bars indicate the standard error in the mean.
Other observations, based on glacier length records, suggest that glacier retreat has occurred nearly continuously since the early 1800s and the end of the little ice age, but variations in rate have occurred, including a significant acceleration during the twentieth century that is believed to have been a response to global warming (Oerlemans 2005).
Data
These measurements are described in Dyurgerov (2002), updated in Dyurgerov and Meier (2005), and archived at the World Glacier Monitoring Service at the National Snow and Ice Data Center. [1] Archivkopie in der Wayback Machine [2]
Copyright
This figure was prepared by Robert A. Rohde from published data and is part of the Global Warming Art project.

|
Es ist erlaubt, die Datei unter den Bedingungen der GNU-Lizenz für freie Dokumentation, Version 1.2 oder einer späteren Version, veröffentlicht von der Free Software Foundation, zu kopieren, zu verbreiten und/oder zu modifizieren; es gibt keine unveränderlichen Abschnitte, keinen vorderen und keinen hinteren Umschlagtext.
Der vollständige Text der Lizenz ist im Kapitel GNU-Lizenz für freie Dokumentation verfügbar. |
| Diese Datei ist unter der Creative-Commons-Lizenz „Namensnennung – Weitergabe unter gleichen Bedingungen 3.0 nicht portiert“ lizenziert. | ||
| ||
| Diese Lizenzmarkierung wurde auf Grund der GFDL-Lizenzaktualisierung hinzugefügt. |
References
- Dyurgerov, Mark B. (2002). "Glacier Mass Balance and Regime: Data of Measurements and Analysis". Institute of Arctic and Alpine Research, Occasional Paper 55.
- Dyurgerov, Mark B. and Mark F. Meier (2005). "Glaciers and the Changing Earth System: A 2004 Snapshot". Institute of Arctic and Alpine Research, Occasional Paper 58.
- J. Oerlemans (2005). "Extracting a Climate Signal from 169 Glacier Records". Science 308 (5722): 675 - 677.
Dateiversionen
Klicke auf einen Zeitpunkt, um diese Version zu laden.
| Version vom | Vorschaubild | Maße | Benutzer | Kommentar | |
|---|---|---|---|---|---|
| aktuell | 21:02, 23. Sep. 2006 | | 658 × 500 (20 KB) | wikimediacommons>Xavax | == Summary == == Description == This figure shows the average rate of thickness change in mountain glaciers around the world. This information, known as the glaciological mass balance, is found by measu |
Dateiverwendung
Die folgende Seite verwendet diese Datei: